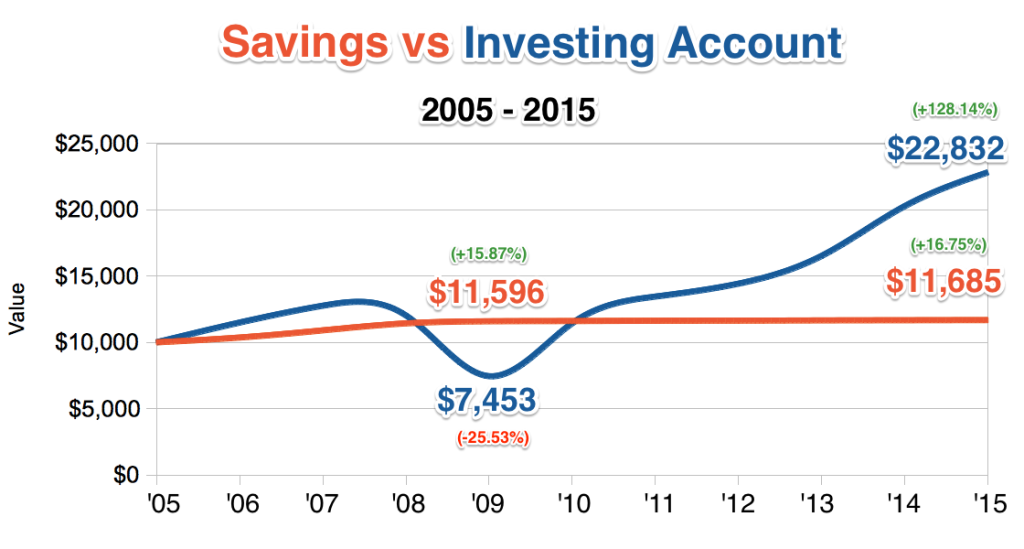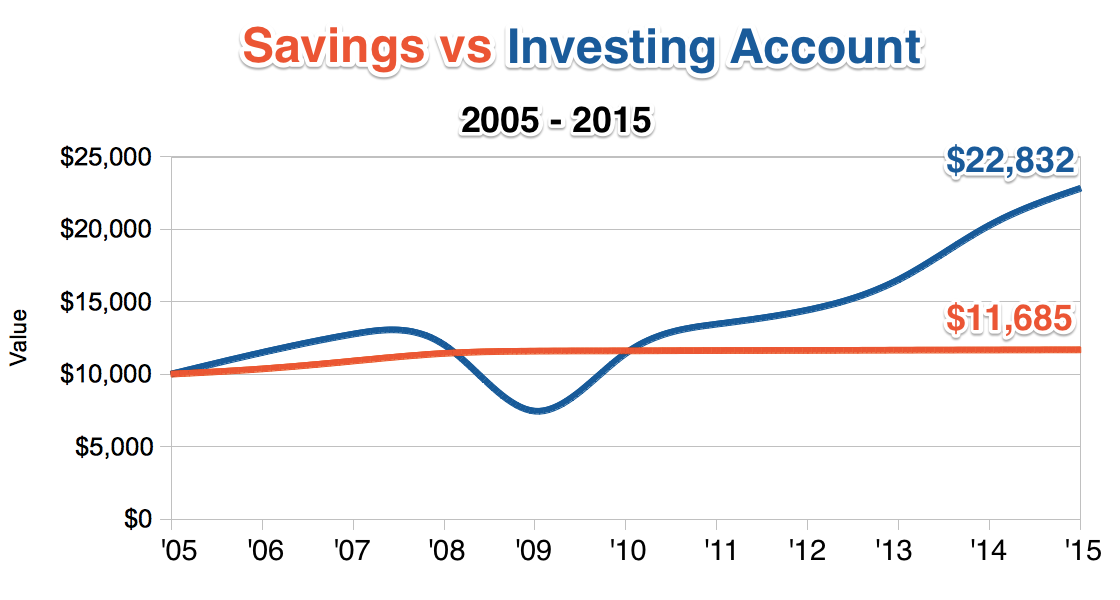
I hope this chart is self-explanatory. But in the case that it might not be. Let me explain it for you. If you had $10,000 in March of 2005, this is how much money you’d have if you had either put it into a savings account (red/orange line) or had invested it in the stock market (blue line). It’s 2015 now and 10 years later, this is how much money you’d have in your account. Which would you prefer? This chart shows why an investment account is better than a savings account.
So, if you’ve paid off your debts, saved up a couple $1,000 and now you’re curious about how to put that money to work, look no further. You’re asking yourself, “what should I do with X dollars?” Should you invest in the stock market or put it into a savings account? Look at that chart and you tell me.
Savings account interest rates suck
Interest rates are at an all-time low – currently less than 1%. Historically they’ve hovered around the 5-6% range. That’s not bad. But since late 2008 when the Fed decided to attempt to prop up the economy by cutting rates, savings accounts haven’t even come close to competing with the stock market. If you keep your money in a savings account, you’re literally losing money to inflation.
source: tradingeconomics.com
Notice how the dotted line (inflation rate) is mostly above the black line (interest rates). That means your savings account is not growing as fast as inflation. That’s bad. Your dollars are losing value. Your candy bar is getting more valuable than your dollar. You know how your grandpa says that candy bars used to cost a nickel? But now they cost a dollar? It’s not the candy bar – it’s inflation. Your grandpa also used to live off of $1,500/yr. See that flat line after 2008? That’s the Federal Reserve trying to “jumpstart the economy” by cutting interest rates to basically 0.
The overall economy is strong
I’m a believer in index funds. If you think the overall economy will continue to grow, then you should invest in it. Obviously the past is not a guarantee of the future, but it’s a fairly decent predictor. History repeats itself?
So, what’s the historical return on an investment in the overall economy for the last 3, 5, and 10 years? I’m going to use VTI as my benchmark. It’s Vanguard’s ETF that invests in over 1,000 of the largest companies in the US. That’s what I used to represent the blue line in the chart above. Here are the past returns.
| Years | Total Return | Annual Return |
|---|---|---|
| 3 | 47.7% | 15.9% |
| 5 | 81.6% | 16.32% |
| 10 | 82.34% | 8.23% |
Why is the 10 year average return much lower? Because it includes the crash of 2008. See that dip in ’09? That’s the risk of investing vs saving. But look carefully. Had you taken money out anytime earlier, you would’ve been ahead compared to saving. And you only had to wait 1 year from the low in 2009 to break even again in 2010. One year! If you can’t wait a year, don’t invest. But if you can wait 3 years or more, then you’re really going to want to make the most of those saved dollars.
Pessimistic person: What if there is another crash? I don’t want to lose all my money.
Response: that’s why I’m not talking about what to do with your money in the short term. We’re talking mid to long range timeframes – at least 3 years. The longer the better.
Optimistic person: That’s awesome! Savings accounts are offering 1% and even if I endure a terrible crash like 2008, I can still earn an average of 8.6% on my money every year! Let’s do this!
Historically, investing in the overall market has beaten saving your money in a savings account. So put that money to work and open up yourself an investment account.